SuperSeasonals: Seasonal Stock Analysis Platform
A .NET rebuild of a PHP application in which opportunity generation had become the bottleneck. We rebuilt it around precomputation and caching, and the client reports custom report generation running 5x faster and the weekly opportunity run 8x faster. The platform scans 20+ years of historical price data to surface the weeks of the year a given symbol has consistently moved up or down, so retail traders can time entries and exits without doing the math themselves.
 Client: The Spyrol Group LLC (US)Ryan Jones, CEO13+ year client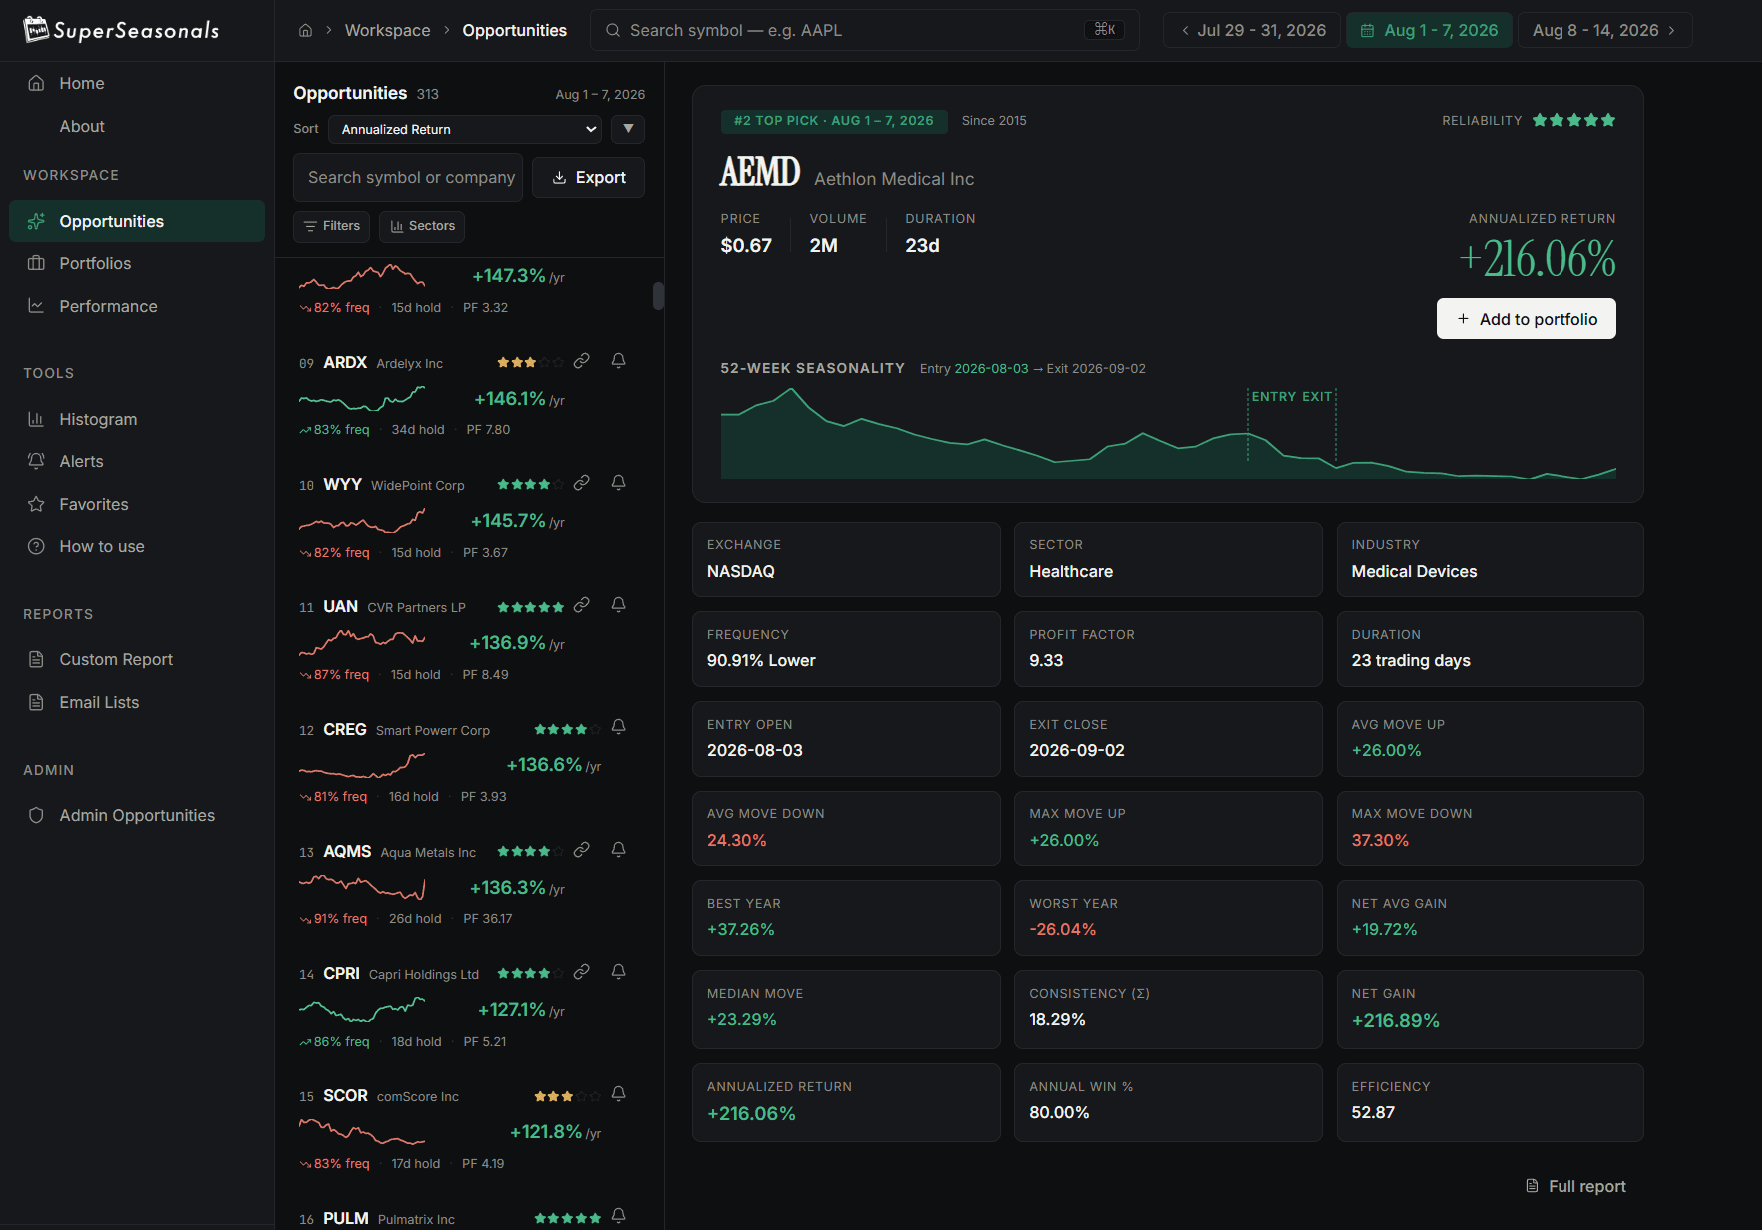
20yr+
Historical Depth
16
Metrics Per Opportunity
Since 2018
In Production
The Challenge
Opportunity generation in the existing PHP application was slow enough that it limited how the product could be used
Manually reviewing 20 years of weekly price history per symbol is too slow to act on before a seasonal window closes
Most charting tools show price but don't tell a trader which calendar weeks have historically moved a stock in one direction with high frequency
Traders need a way to filter the universe down to only the symbols whose seasonal pattern is actually significant for the current week
After picking a candidate, traders still want sector context (is this a one-off symbol or part of a December financials trend?) before committing capital
Going back to the platform every Monday to re-run the same screen is friction; users want alerts and email digests pushed to them
Our Approach
We built SuperSeasonals as a focused tool for one job: rank stocks by their historical seasonal edge for a given week of the year. The Angular frontend gives traders a workspace for opportunities, portfolios, performance tracking, custom reports, alerts, and TradingView charts. The .NET 10 API runs on SQL Server with EF Core for schema and Dapper for the heavy seasonal queries that power the opportunities ranker. Background workers keep market data and symbol metadata current outside the API process, so the user-facing app stays responsive even on busy mornings. The rebuild moved the expensive work off the request path entirely. A scheduled job precomputes every symbol's opportunities and rebuilds all 60 ranked week-and-month lists ahead of demand, so whichever week a trader opens, the answer already exists rather than being calculated while they wait; custom reports regenerate on their own schedule in a separate long-running service. Four cache layers sit behind that, from the process-wide symbol universe down to per-run memoization, and a startup warm-up means the first visitor after a deploy pays nothing for it. The API itself carries per-user rate limiting, structured logging, and response compression negotiated per request.
Key Features
View Opportunities ranks the top symbols for any week of the year and shows each one as a card with profit factor, duration, average move up and down, net gain, annualized return, and annual win rate, all sortable and filterable
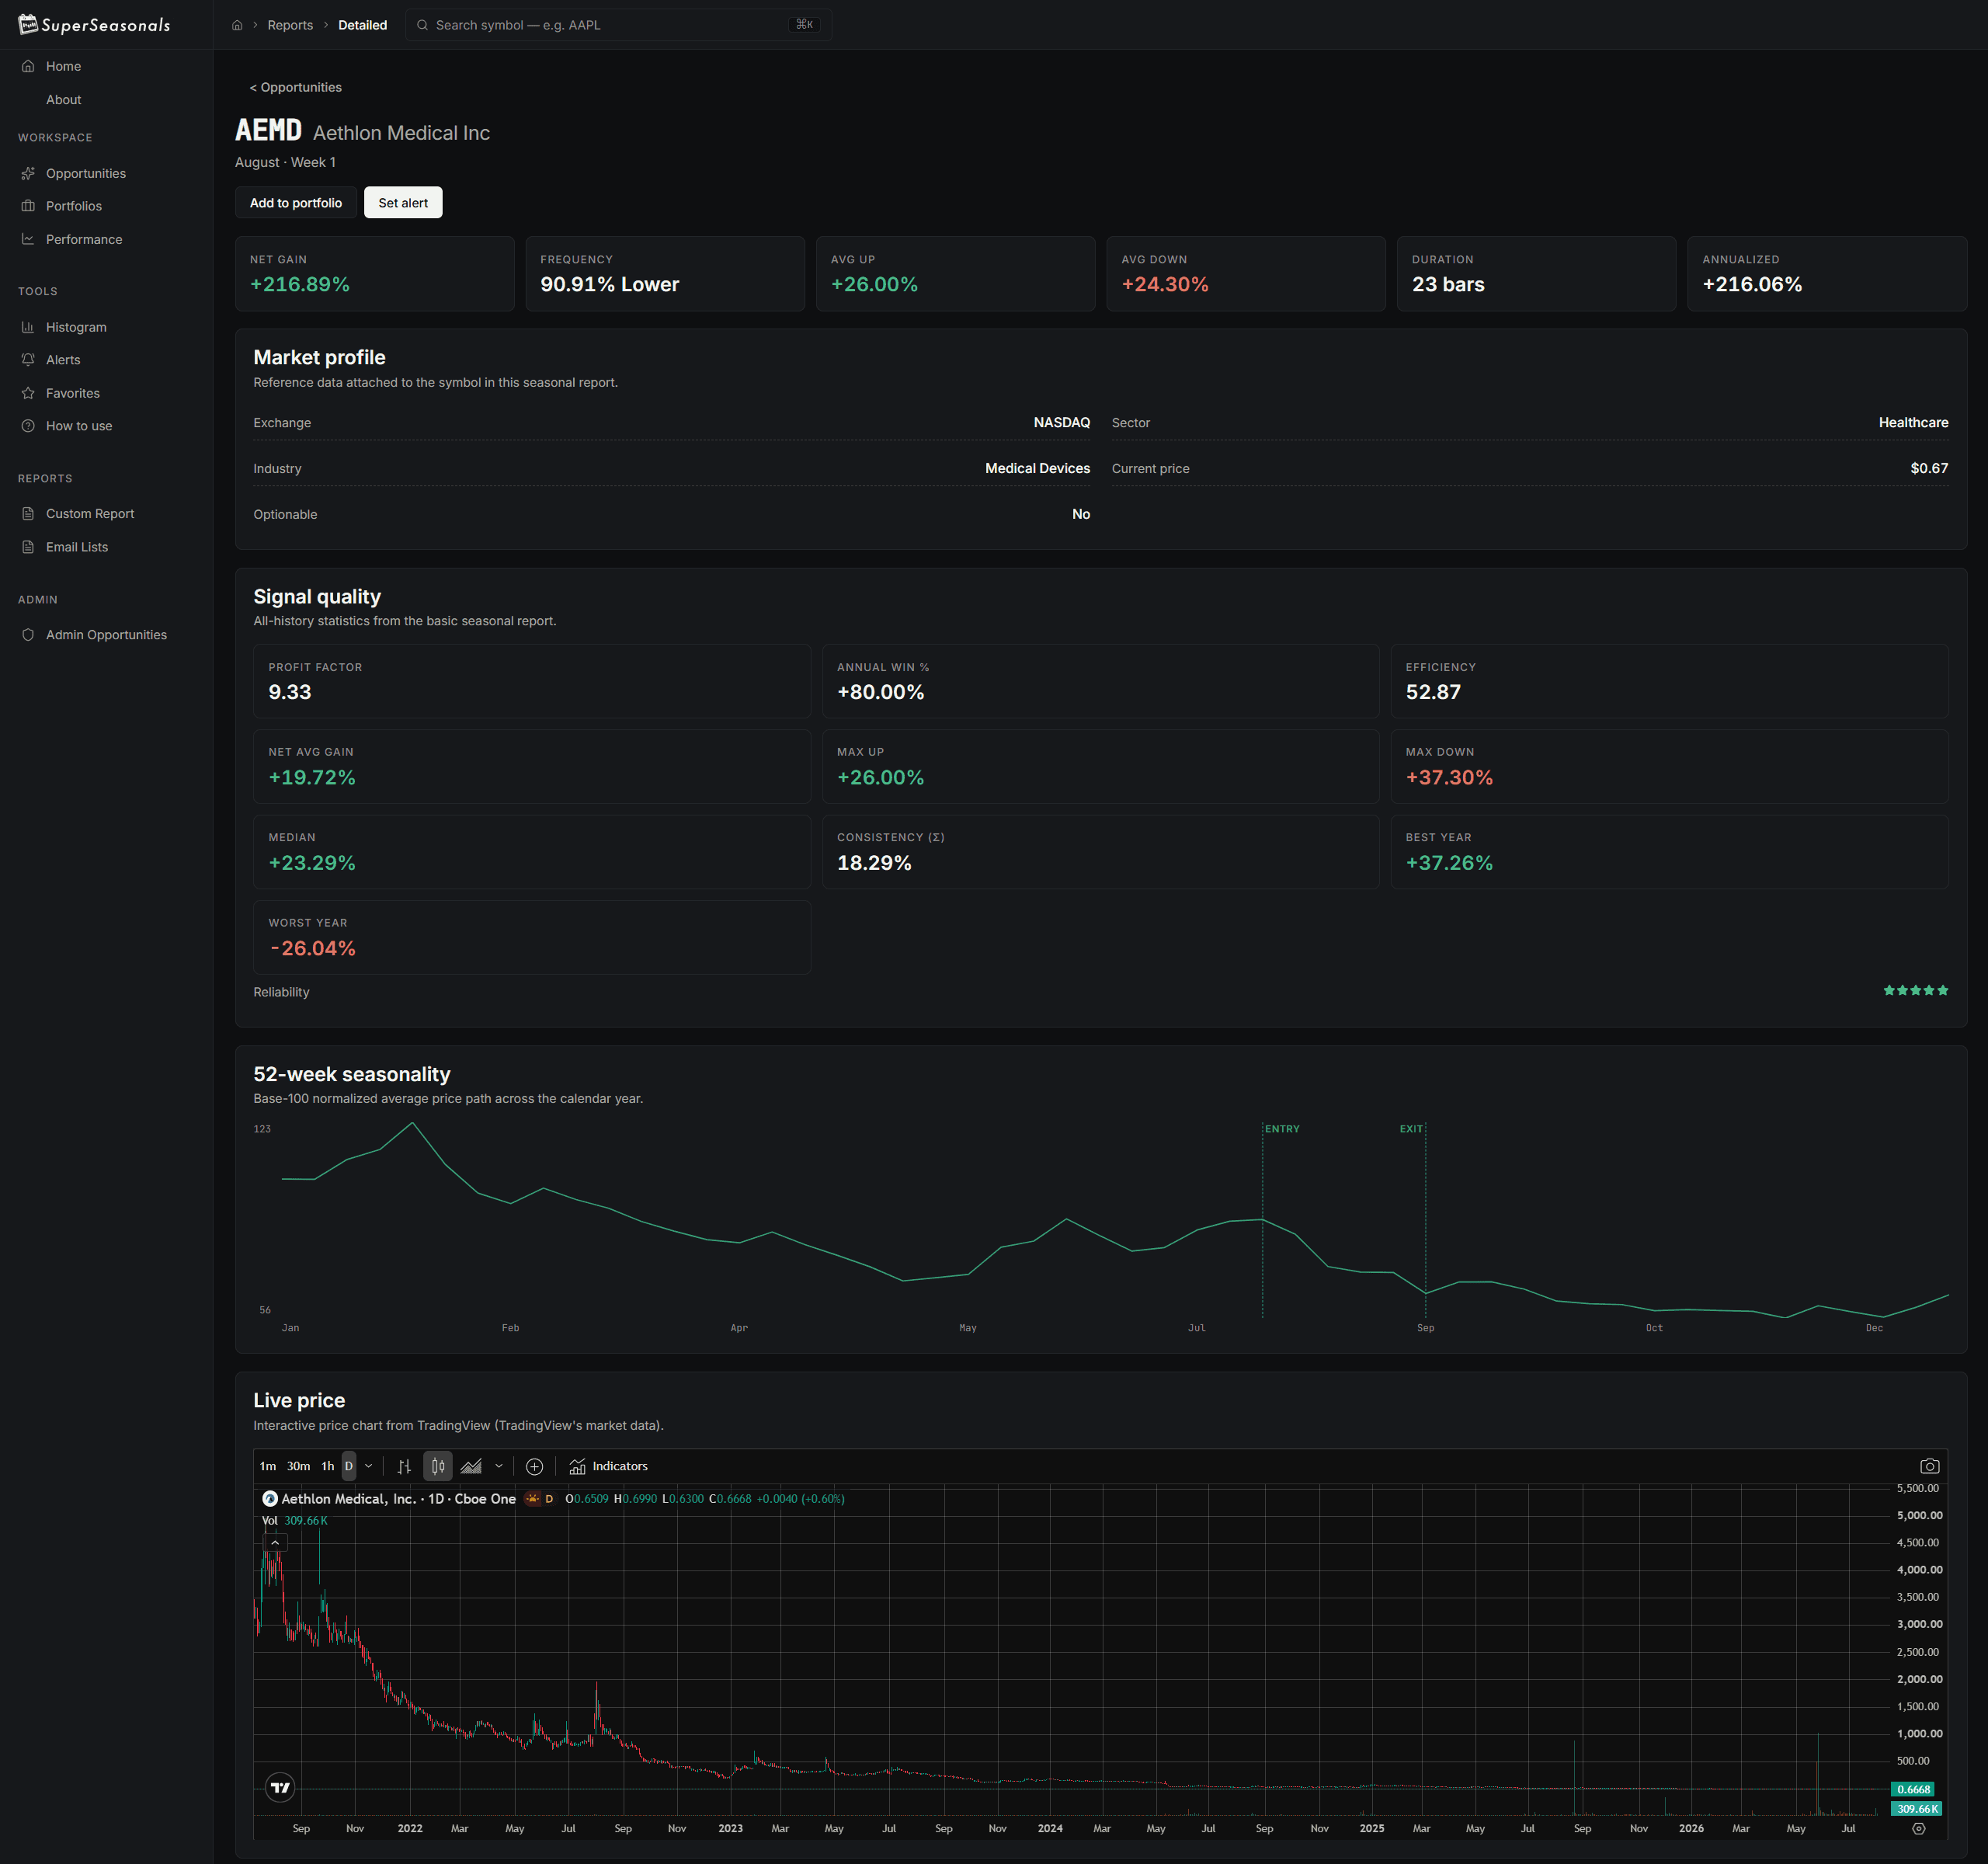
Seasonal Performance runs a full backtest on any symbol across 20+ years of history with summary metrics (total net profit, profit factor, winners, max consecutive wins and losses, annualized return) plus an equity curve
Histogram Chart renders monthly and weekly average-move and percent-move charts for visual seasonal scanning
Custom Reports with Auto-Export let traders save a screen and have it re-run on a schedule, with results pushed out automatically
Portfolios cover the full position lifecycle (open, closed, pending, manual) with day-wise performance and trade-alert info across multiple portfolios
Alerts include the impending move, sector and industry, entry point, duration, historical movement, performance report, and cumulative net increase
Favorite Symbols and Opportunity Notifications subscribe per user to symbols, weeks, months, or combinations, with a log of what was sent
SmartShareEmail pushes opportunities and performance reports to subscribers' inboxes so they don't have to log in to see the next week's setups
Admin Opportunities and a TradingView UDF-compatible charting layer round out the platform with operator-side controls and in-app technical analysis
A per-opportunity reliability rating scores how dependable a seasonal signal is, so a trader triages a 313-row week instead of reading it top to bottom
Competitor Seasonality lists sector and industry peers for the same calendar week beside the symbol being viewed, turning a single-symbol answer into a comparison
Month Wise Weekly Detail filters a symbol's qualifying weeks by a minimum frequency and a minimum run of consecutive weeks, surfacing sustained windows rather than one-week flukes
Modernization
| Aspect | Before | After |
|---|---|---|
| Framework | Angular 14 | Angular 21 |
| Styling | Dated light theme | Tailwind CSS 3, dark-first workspace |
| Navigation | Top menu bar of 12 links | Sidebar workspace with keyboard symbol search |
| Charting | Static equity-curve image | TradingView Advanced Chart on a UDF-compatible datafeed |
| Opportunity detail | 10 metrics per card | 16 metrics, a reliability rating, and a 52-week seasonality path |
Framework
Before: Angular 14
After: Angular 21
Styling
Before: Dated light theme
After: Tailwind CSS 3, dark-first workspace
Navigation
Before: Top menu bar of 12 links
After: Sidebar workspace with keyboard symbol search
Charting
Before: Static equity-curve image
After: TradingView Advanced Chart on a UDF-compatible datafeed
Opportunity detail
Before: 10 metrics per card
After: 16 metrics, a reliability rating, and a 52-week seasonality path
Tech Stack
The Result
Custom report generation 5x faster, the weekly opportunity run 8x faster. 20+ years of price history. In production since 2018.
Traders open the app, pick a week, and see a ranked list of symbols with the strongest historical seasonal edge in seconds. No more charting tickers by hand to find the pattern.
They filter, drill into a 20-year breakdown, save the screen as a custom report that auto-exports on a schedule, and subscribe to email notifications. Portfolio Tracker keeps the trades they take linked back to the seasonal thesis, so they can measure whether the pattern actually paid.
Building an analytics or research tool for traders?
Historical data at scale, custom scanners, performance backtests, scheduled reports. We ship analytics products that traders use every week. Tell us about yours.
Get a Free Quote